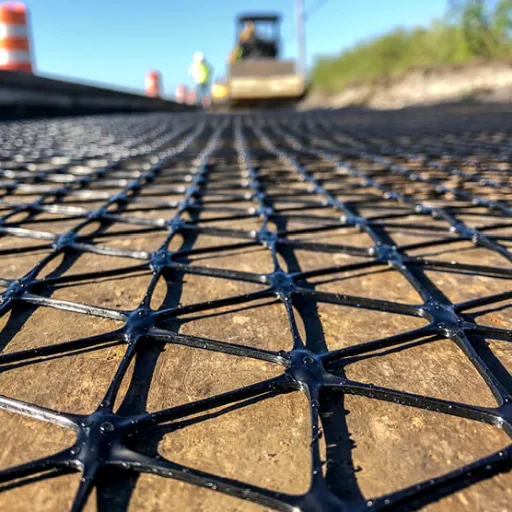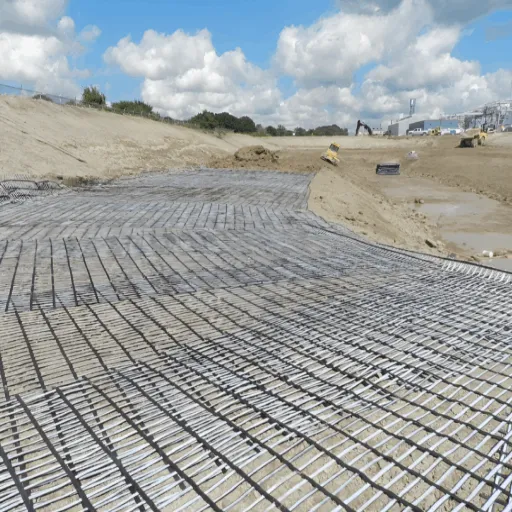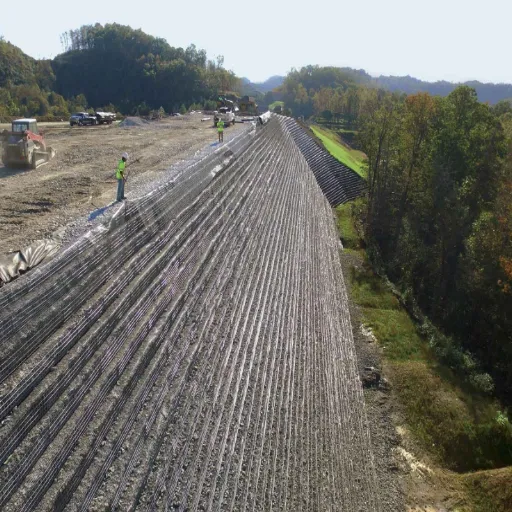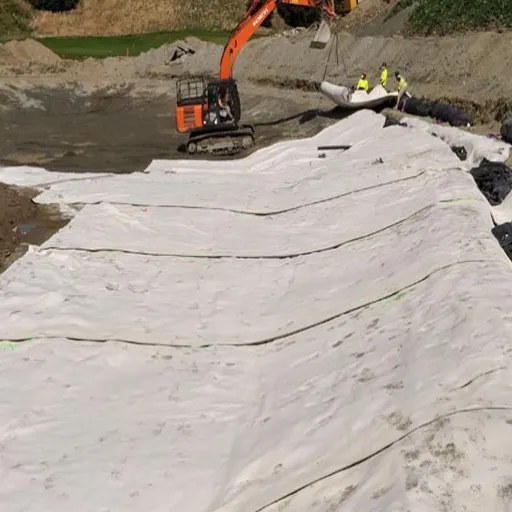
A geogrid spec sheet is read in five blocks: index properties, tensile strength, structural integrity, durability, and roll dimensions. Tensile strength, the number engineers compare most, is reported three ways, at 2 percent strain, at 5 percent strain, and at ultimate, and none of those values is the same as the long-term design strength (LTDS) you actually design with. This guide decodes every line of a typical geogrid specification, maps each property to the ASTM or ISO test method that measures it, and shows you what a good value looks like for each type of grid.
Ask Rosa, a procurement engineer who sourced grid for a 40,000-square-meter logistics yard in 2025. She shortlisted two biaxial grids, both labeled “30 kN/m,” and almost chose on price. Then she read the datasheets line by line. Grid A reported “typical” values; Grid B reported minimum average roll values (MARV). Grid A listed ultimate strength only. Grid B showed strength at 2 and 5 percent strain, a junction efficiency of 95 percent, and a 39 x 39 mm aperture that matched the 20 mm aggregate. She asked both suppliers for third-party MARV test reports. Grid A could not provide them. She bought Grid B, and the yard has carried loaded trailers through two seasons without a rut.
Most buyers never read that far. Manufacturer guides explain concepts without giving you numbers, datasheets give numbers without explaining them, and agency specifications are fragmented by state and country. This article stays neutral because a geogrid supplier that sells biaxial, triaxial, and uniaxial grids has no product line to defend. You will finish knowing what each specification means, how tensile strength is tested and why it is reported at different strains, how junction efficiency and aperture control real performance, and how to compare two spec sheets honestly. If you need the family overview first, our complete geogrid guide to types and applications covers uniaxial, biaxial, and triaxial grids, how they reinforce soil, and where each type is used.
Key Takeaways
- Tensile strength is an index value reported in kN/m at 2 percent strain, 5 percent strain, and ultimate; stiffness at low strain, not ultimate strength, governs most road applications.
- ASTM D6637 (single or multi-rib) is the geogrid-specific tensile test; ASTM D4595 is a wide-width geotextile test that independent research found less accurate on geogrids.
- Junction efficiency of at least 90 to 95 percent is the norm, and low junction efficiency causes failure at the nodes before the ribs reach full strength.
- Long-term design strength (LTDS) is the value used in reinforced-soil design and typically equals 33 to 57 percent of ultimate strength depending on the polymer.
- Always compare minimum average roll values (MARV), check both machine and cross directions, and verify the test method before you trust a number.
How to Read a Geogrid Specification Sheet

Every geogrid datasheet organizes the same five groups of properties. Learn where each number lives and you can read any supplier’s sheet.
- Index and physical properties: polymer, aperture size, mass per unit area, rib dimensions, and open area.
- Tensile properties: strength at 2 percent and 5 percent strain and ultimate tensile strength, reported in machine (MD) and cross (CD) directions.
- Structural integrity: junction efficiency, flexural stiffness, and aperture stability.
- Durability: resistance to installation damage, UV, and long-term degradation, plus carbon black content.
- Dimensions and delivery: roll width, length, and packaging.
MD vs CD: Check Both Directions
Machine direction (MD) runs along the roll. Cross direction (CD), also called cross-machine or transverse, runs across it. A biaxial grid must meet minimums in both, and a single-direction value is meaningless without its direction label. Spec sheets present pairs such as “30/30 kN/m” or separate MD and CD columns. If you see one number with no direction, ask for the full table.
Typical vs MARV: The Numbers Are Not the Same
The most common buying mistake is comparing a “typical” value from one supplier against a MARV from another. MARV stands for minimum average roll value, and it is the statistically guaranteed minimum that a roll must meet across samples. Typical values are the average you might expect, which means the MARV can sit several percent below the “typical” figure on the same datasheet.
Agencies and design codes qualify geogrids on MARV, not on typical values. When you compare products, request the MARV test reports. A grid quoted at “40 kN/m typical” with a MARV of 36 kN/m is not the same product as one quoted at 40 kN/m MARV.
kN/m vs lb/ft
Tensile strength is reported as force per unit width, kilonewtons per metre (kN/m) or pounds per foot (lb/ft), because a grid carries load through discrete ribs across the width. One kN/m equals about 68.5 lb/ft. Check the unit on every column; a sheet that mixes lb/ft and kN/m without labels is a red flag.
What Is Geogrid Tensile Strength?

Geogrid tensile strength is the maximum tensile force a geogrid can carry per unit width before rupture, expressed in kilonewtons per metre (kN/m), and measured by pulling rib or multi-rib specimens until they fail. It is an index property: a standard number for comparing products, not the value a designer plugs into a reinforced-soil calculation.
Why per unit width rather than as a material stress? A geogrid is not a solid sheet. It transfers load through ribs, so its capacity depends on how many ribs cross each metre of width. Report the load per rib, multiply by the ribs per metre, and you get kN/m. That is why a light grid may be “15 kN/m” and a heavy wall grid “200 kN/m” or more.
Keep this distinction in mind for the rest of the article: ultimate tensile strength tells you what the grid can survive in a short test. What happens over 120 years under sustained load is a different question answered by LTDS, which we reach later.
Why Spec Sheets List Tensile Strength at 2% and 5% Strain
Soil and aggregate structures rarely load a grid anywhere near its breaking point. They work at small strains, and what matters is how much load the grid develops at those low strains. That is stiffness, reported as the secant tensile strength at 2 percent and 5 percent strain.
Think of it this way. A wheel pushes down, the aggregate tries to spread, and the grid must hold the layer together at a few percent strain. A grid that develops 7 kN/m at 2 percent strain confines the aggregate more firmly than a grid that develops 3 kN/m at the same strain, even if both carry the same ultimate load. This low-strain behavior is the mechanism behind geogrid soil reinforcement, which we explain in depth in our geogrid soil reinforcement guide.
Representative values help you calibrate a datasheet. Extruded polypropylene (PP) biaxial grids in the common 20 to 50 kN/m strength range typically report:
| Grade | Ultimate MD = CD (kN/m) | At 2% strain (kN/m) | At 5% strain (kN/m) | Common aperture |
|---|---|---|---|---|
| Light (BX1100 class) | ~12 to 19 | 4 to 7 | 8 to 13 | 25 x 33 mm |
| SS20 / SB2020 | 20 | ~7 | ~14 | 39 x 39 mm |
| SS30 / SB3030 | 30 | ~10.5 | ~21 | 39 x 39 mm |
| SS40 / SB4040 | 40 | ~14 | ~28 | 33 to 38 mm |
| SS50 / SB5050 | 50 | ~17.5 | ~35 | 33 x 33 mm |
The higher grades tighten their apertures as the ribs get heavier, which is why interlock and strength go together. Elongation at break, usually 11 to 16 percent for PP biaxial, is reported separately and tells you little about service behavior.
These are representative classes, not a promise. Always confirm the exact values and MARV on the product’s certified test report. For a comparison of how biaxial and triaxial grids differ in stiffness and load spread, see our biaxial vs triaxial geogrid guide.
The Test Methods Behind the Numbers: D6637 vs D4595 vs ISO 10319
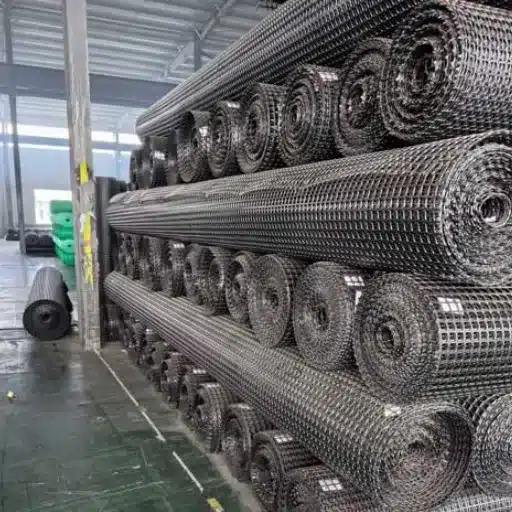
A tensile strength figure is only meaningful if you know which test produced it. Three standards dominate, and they are not interchangeable.
ASTM D6637/D6637M, “Determining Tensile Properties of Geogrids by the Single or Multi-Rib Tensile Method,” is the geogrid-specific standard. Method A tests a single rib and reports load. Method B tests a multi-rib wide specimen clamped at its junctions and reports load per unit width. Method C tests multiple layers of ribs. Because it clamps on the junctions and accounts for ribs per unit length, D6637 is the method agencies moved to for geogrids.
ASTM D4595, the wide-width strip test, was written for woven geotextile fabrics, not open grids, and it does not account for the rib structure. When a geogrid datasheet cites D4595, treat the number with caution, and read more on how fabrics differ in our geogrid vs geotextile guide.
ISO 10319:2024, the international wide-width tensile test for geosynthetics, is the standard most non-US manufacturers quote, often alongside ASTM D6637. Specimen geometry must be adapted for open grid structures, which is why Queensland’s transport specification accepts either D6637 or ISO 10319 for geogrid tensile values.
Independent research shows the choice of standard matters. A Wisconsin Department of Transportation study tested 188 specimens from three rolls of biaxial geogrid. Using ASTM D4595, tensile strength at 5 percent strain varied between 485 and 754 lb/ft with a coefficient of variation of 22 percent across the same roll. Using ASTM D6637 Method B, results were more consistent, and the researchers recommended D6637 for geogrid specification and design.
Here is a mini-story that shows what this means on site. In 2019, a contractor in the upper Midwest installed a grid spec’d from a datasheet that used D4595. When the state’s conformance lab retested the delivered rolls with D6637 Method B, several fell short of the spec, and the grid had to be removed before aggregate placement. The material had not changed. The test method had. A five-minute check of the datasheet’s standard before ordering would have prevented the delay. When a supplier certifies values to D6637 and provides the MARV report, you remove that entire class of failure.
Junction Efficiency: The Number Most Buyers Skip
Junction efficiency is the strength of a geogrid junction, where the ribs cross, divided by the strength of the rib itself, expressed as a percentage, and it measures how well the grid transfers load through its nodes. Ribs carry tension, but only junctions move that load into the soil and across the grid. If a junction is weaker than its rib, the grid fails at the nodes before the ribs ever reach full strength.
The formula on a datasheet looks like this:
Junction efficiency = junction strength / rib tensile strength x 100
It is measured by testing an individual junction, per ASTM D7737 or the Geosynthetics Research Institute’s GRI-GG1 and GRI-GG2 methods. Typical minimums run 90 percent in many agency specifications and 93 to 95 percent on commercial PP grids, with some brands stating 95 percent or higher.
A low junction efficiency quietly destroys performance. The grid holds aggregate while it lies flat, but under repeated wheel loads the weak nodes open, the ribs stop sharing load, and the reinforcement fails from the inside. Junction efficiency is grouped with two related structural properties on spec sheets: flexural stiffness (ASTM D7748), the resistance to bending, and aperture stability (ASTM D7864), the resistance to in-plane rotational movement. Together they describe how rigid the grid stays while aggregate interlocks with it.
Aperture Size and the Aggregate Match
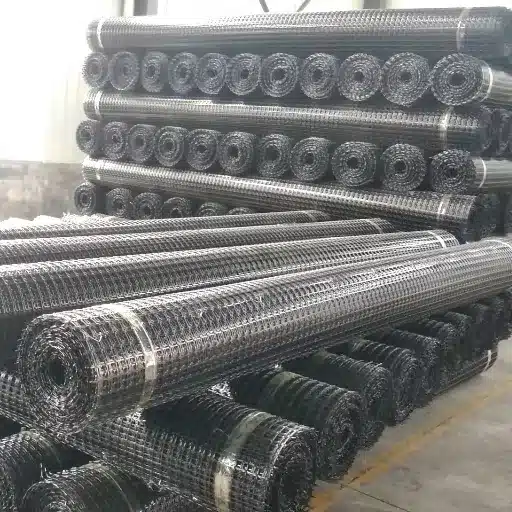
A geogrid reinforces by letting aggregate push through its apertures and lock against the ribs. Get the aperture wrong and the strongest grid in the catalogue will do nothing.
The practical rule: the aperture should be roughly 1.5 to 3 times the nominal aggregate diameter so particles bite into the openings. When aggregate is smaller than the opening, it falls through without interlocking. When it is far larger, it sits on top of the grid instead of through it. Interlock is best when the aggregate’s D50 is about 50 to 100 percent of the aperture dimension.
Typical apertures give you a sense of scale. PP biaxial grids run 25 to 40 mm, with 33 to 39 mm the most common. Uniaxial grids run about 12 to 50 mm depending on the aggregate they hold. A composite that pairs geogrid with geotextile adds a separation layer, useful when you reinforce and separate at the same time; for that trade-off, our geogrid vs geotextile guide compares the material families in full.
Typical Geogrid Specifications by Type
Spec values differ by manufacturing process, so it helps to see the three families side by side.
Extruded PP biaxial geogrids carry balanced two-direction strength, roughly 12 to 50 kN/m in the common grades with equal MD and CD values, apertures of 25 to 40 mm, junction efficiency of 93 percent or more, elongation around 11 to 16 percent, and a minimum 2 percent carbon black. They are the economical standard for roads and working platforms.
Uniaxial PP or HDPE geogrids concentrate strength in one direction, from roughly 30 up to 200 kN/m and beyond in grades such as PP35 to PP200. Elongation at maximum load stays at or under 10 percent, carbon black is at least 2 percent, and elongated rectangular apertures are characteristic. They reinforce mechanically stabilized earth walls and steep slopes, which is where uniaxial geogrid for retaining and MSE walls matters most.
Warp-knitted PET geogrids are drawn from high-tenacity polyester yarn and coated, usually with PVC, in grades from roughly 20 up to 800 kN/m and higher. Elongation runs about 10 to 13 percent, creep is low, and apertures typically land between 12 and 50 mm. PET carries sustained load with less creep than PP or HDPE, which shows up directly in LTDS.
The geometry and strength differences between square and triangular grids deserve their own treatment. Our biaxial vs triaxial geogrid comparison covers aperture shape, radial stiffness, and the independent data behind each.
Ultimate vs Long-Term Design Strength (UTS vs LTDS)
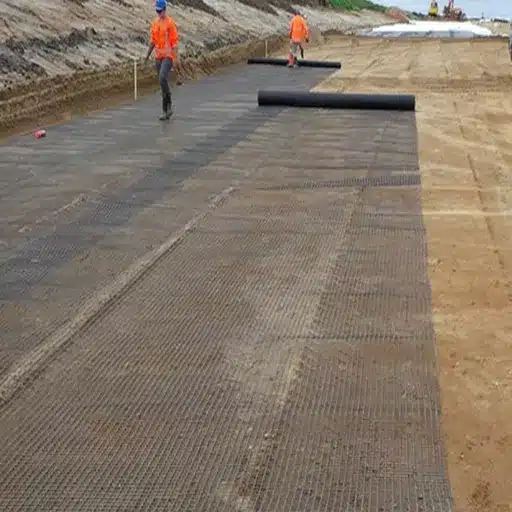
Long-term design strength (LTDS) is the ultimate tensile strength reduced by product-specific factors for creep, installation damage, and durability, so the grid can hold its load for the structure’s design life, typically 120 years, without creeping to failure. This is the number a geotechnical designer uses. Ultimate tensile strength is the number a sales sheet prints in large type.
The relationship is simple in form:
LTDS = ultimate tensile strength / (creep factor x installation damage factor x durability factor)
Each reduction factor comes from product-specific testing, not a generic table. Creep is measured per ASTM D5262 or the stepped isothermal method ASTM D6992. Installation damage is assessed per ASTM D5818. Durability covers chemical and UV ageing. The long-term-strength procedures are standardized in AASHTO R 69 and ISO/TS 20432.
Worked examples make the fraction real. A coated PET geogrid at 60 kN/m ultimate carries a long-term design strength around 34 kN/m, and an 800 kN/m grade carries about 452 kN/m, so PET retains roughly 55 to 57 percent of its ultimate value over a 120-year life, as published on the SIGMA polyester geogrid datasheet. A 210 kN/m PP or HDPE uniaxial grid drops to roughly 74 kN/m allowable strength after a creep factor of about 2.7, closer to 35 percent. Across the industry, LTDS commonly lands between 33 and 50 percent of ultimate, with polyester retaining the most and polypropylene the least.
Here is the mistake this creates. A wall designer comparing two grids on ultimate strength might pick a 200 kN/m PP grid over a 180 kN/m PET grid, because 200 beats 180. But the design comparison should use LTDS at the design life. The PET grid keeps about 102 kN/m; the PP grid keeps closer to 70 kN/m. The lower-ultimate product is the stronger one in the wall.
Durability, Creep, and the 120-Year Design Life
Two grids with identical tensile tables can diverge completely over decades. Durability is where they separate.
Creep is the dominant long-term risk for PP and HDPE under sustained load. A polymer loaded for 120 years slowly stretches, and creep strength is found by hanging weights on samples under temperature control for thousands of hours, then extrapolating. PP and HDPE creep more than PET, which is why permanent structures favor polyester reinforcement and why PP grids carry larger creep reduction factors.
UV is a construction-phase risk. An uncovered grid left in the sun loses strength, so PP and HDPE grids compound at least 2 percent carbon black to slow degradation, and the grid should be covered with aggregate within days of placement. FHWA default durability factors assume a minimum UV retention, roughly 70 percent strength retained for PP and HDPE and 50 percent for PET after 500 hours per ASTM D4355. Our geogrid installation guide covers how to protect the grid once it reaches site.
Installation damage is the other reduction factor: compaction equipment abrades and cuts ribs, so the installation-damage factor starts at about 1.1 and can climb higher on sharp, coarse fill. This is why a strong datasheet value means little if the grid is mishandled in the field.
Finally, read “120-year design life” correctly. It is a testing horizon used to derive LTDS, not a warranty that the polymer survives 120 physical years. It means the grid is engineered to carry its allowable load for that period at the tested temperatures and soil conditions.
How to Compare Geogrid Spec Sheets From Different Suppliers
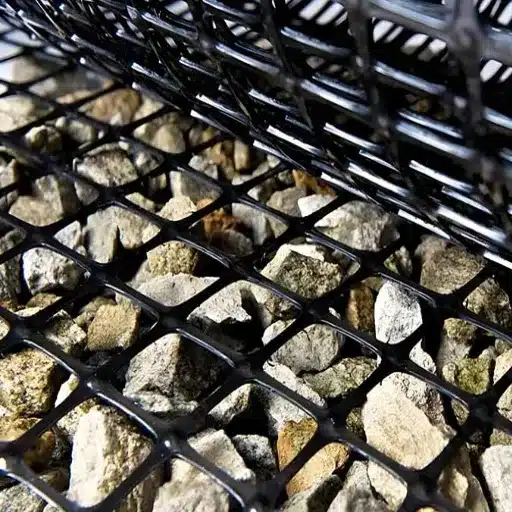
By now you can see why two “30 kN/m” grids are rarely equal. Here is a five-step comparison you can run on any pair of datasheets.
- Match the test method. Compare D6637 to D6637, not D6637 to D4595, and note whether the ISO 10319 value uses adapted geometry.
- Compare MARV, not typical. Request the certified minimum average roll value for every quoted property.
- Check both directions. Confirm the MD and CD columns both meet your requirement, not just the stronger one.
- Compare the full structural set. Junction efficiency, flexural stiffness, and aperture stability tell you how the grid behaves once installed.
- Ask for LTDS at your design life. For walls and slopes, compare long-term design strength, not ultimate strength, and confirm the design life it was derived for.
Then verify the supplier. Ask for third-party MARV test reports, ISO 9001 quality systems, carbon black and raw-material traceability, and roll-dimension data that matches your freight plan. A supplier that quotes export-ready geogrids to ASTM and ISO and will share test reports removes most of the risk in this comparison. If you are unsure which grade your project needs, work through the steps in our how to choose a geogrid guide before you commit.
Geogrid Specifications FAQs
What is geogrid tensile strength?
Geogrid tensile strength is the maximum tensile force a geogrid carries per unit width before rupture, reported in kN/m. It is an index value for comparing products, tested by pulling rib specimens to failure.
What is the difference between ultimate tensile strength and long-term design strength?
LTDS is the ultimate strength divided by factors for creep, installation damage, and durability for a stated design life, usually 120 years. It typically equals 33 to 57 percent of ultimate and is the value used in reinforced-soil design.
Why is geogrid tensile strength measured at 2% and 5% strain?
Structures work at low strain, so secant strength at 2 and 5 percent strain measures the stiffness that confines aggregate in service. Ultimate strength alone does not capture that.
What is the difference between ASTM D6637 and ASTM D4595?
D6637 is the geogrid-specific single or multi-rib tensile test. D4595 is a wide-width geotextile test that independent research found less accurate and more variable on geogrids.
What does junction efficiency mean?
Junction efficiency is junction strength divided by rib strength, expressed as a percentage. It measures load transfer through the nodes, and values below about 90 percent risk premature junction failure.
What does kN/m mean in a geogrid specification?
kN/m is force per unit width, kilonewtons per metre, the standard unit for geogrid tensile strength. One kN/m equals about 68.5 lb/ft.
What aperture size geogrid do I need?
Match the aperture to roughly 1.5 to 3 times your nominal aggregate diameter so particles interlock through the openings. Common biaxial apertures run 25 to 40 mm.
How long does a geogrid last?
Geogrids are engineered to a 120-year design life for LTDS purposes. Creep under sustained load is the governing long-term factor, and PET resists creep better than PP or HDPE.
Conclusion
Reading a geogrid spec sheet comes down to a handful of checks. Confirm the test method, ASTM D6637 or ISO 10319, so you are comparing like with like. Read the tensile strength at 2 percent and 5 percent strain, not just the ultimate value. Verify junction efficiency at or above 90 to 95 percent and match the aperture to your aggregate. Compare MARV, never “typical.” And for walls and slopes, design with long-term design strength, which typically lands between a third and a half of ultimate.
Specifications are the language of engineering procurement, and the suppliers worth working with will answer every line of your checklist. Shanxi Shengxing Building Materials supplies biaxial, uniaxial, and PET geogrids qualified to ASTM and ISO, and we publish MARV test reports with every export order. Our geogrid product range covers road stabilization, retaining walls, and slope reinforcement, backed by engineering consultation that helps you specify the correct grade the first time.
Need help decoding a datasheet or writing a specification for your project? Contact our engineering support with your aggregate size, design load, and application, and we will recommend the grid that matches your numbers.